Note: This is an article restored from an archive and the project this refers to is no longer maintained. Google Visualizations Tools API has also changed significantly since this is written.
Often it is imperative to visualize data in applications. In my previous post, I showed how visualizing data can shape the outcome of a conversation (in this case a tech visit).
Many of my web applications as of late have been written using CakePHP, and as such I needed a decent go-to graphing tool that didn’t require licensing fees. I researched for different graphing tools, and I finally decided to go with Google’s Visualization API. It’s a javascript SDK that takes client data and adds an iframe containing an interactive graph (or “visualization” as they call it) to the DOM for view.
Most of my data isn’t available to the client side, so I needed a server-side solution. I decided to create a CakePHP helper that functions as a wrapper for the javascript SDK. This allows me to pull the data on the server side and contain that data within PHP. The wrapper takes the data and wraps the proper javascript to fit Google’s SDK for display in the view.
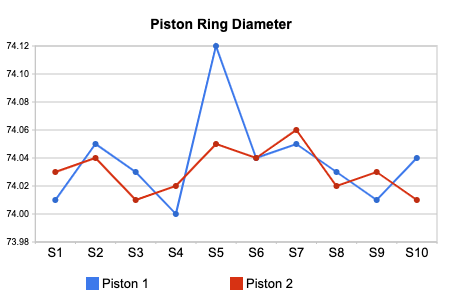
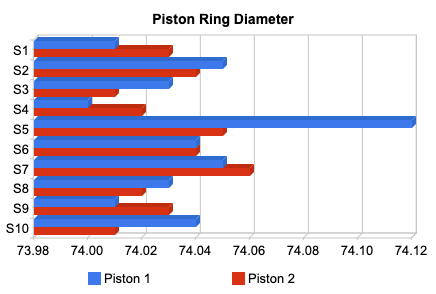
Here is an example of setting some data and displaying a line graph of that data using the visualization:
<?php

$data = array(
   'labels' => array(
      array('string' => 'Sample'),
      array('number' => 'Piston 1'),
      array('number' => 'Piston 2')
   ),
   'data' => array(
      array('S1', 74.01, 74.03),
      array('S2', 74.05, 74.04),
      array('S3', 74.03, 74.01),
      array('S4', 74.00, 74.02),
      array('S5', 74.12, 74.05),
      array('S6', 74.04, 74.04),
      array('S7', 74.05, 74.06),
      array('S8', 74.03, 74.02),
      array('S9', 74.01, 74.03),
      array('S10', 74.04, 74.01),
   ),
   'title' => 'Piston Ring Diameter',
   'type' => 'line'
);

echo $this->GChart->start('test');
echo $this->GChart->visualize('test', $data);
The helper is available free of charge for use in personal and commercial products under MIT.